& Kristalle GmbH

-
 English
-
Deutsch
Keine Artikel
Gesamt zzgl. MwSt.
Gammadiffraktometer
We offer volumetric, nondestructive, structural crystal analysis
Gamma ray diffractometry
What we can offer you
- Volumetric structural analysis of your crystals, e.g., detection of grains, twins, lattice distortions, etc.
- Reports on mosaicity analysis to certify the quality of crystals ordered from us or provided by you
- In situ tuning of crystal mosaicity via mechanical deformation
… mapped out with sub-mm precision across the entire crystal
Inquire now
X-ray diffraction (XRD)
To appreciate the capabilities of gamma diffractometry, it is helpful to understand the concept of x-ray diffraction first. Since its discovery more than a century ago, XRD has become one of the workhorses for structural analyses of crystals. The technique relies on the fact that, under certain angles, x-rays scattered off the atoms in a crystal lattice interfere constructively giving rise to a measurable intensity of the reflected beam. The condition dictating the emergence of such peaks is Bragg’s law
nλ=2dhkl sin θ
where n is an integer, λ is the wavelength of the incident photons, θ is their angle with respect to the crystal surface, and dhkl=a/(h2+k2+l2)1/2 is the effective spacing of crystal planes with a the lattice constant of the crystal and (h, k, l) the Miller indices of the respective plane. Note that this equation is simplified for cubic crystal structures.
As an example, the diffraction peak off the (111) plane of copper at 60keV appears at 2θ=6.8°.
Rotating a crystal irradiated with x-rays while recording the intensity of the reflected photons reveals peaks characteristic for the crystal lattice. The widths of these so-called rocking curves are an indicator for the crystal quality. XRD is hence widely used as a nondestructive crystallographic analysis tool to reveal structural information about materials.

Gamma ray diffraction (GRD)
While gamma ray diffraction is conceptually similar to XRD, utilizing gamma rays – for example emitted by a radioactive isotope – offers crucial advantages for crystal analysis
Volumetric analysis
At photon energies on the order of a few 100keV, absorption coefficients in matter are much smaller and hence photons possess a much higher ability to penetrate the crystal volume. This allows the beam to be transmitted through most elements whereas XRD is typically restricted to analyses at or close to the surface of the material.
As an illustrative example, the absorption length in copper is only about 0.7mm for photons with 59keV corresponding to the widely used Kα emission line of a conventional tungsten x-ray tube. For gamma rays, it is more than an order of magnitude largen with about 10mm at 316keV corresponding to the emission line of a 192Ir isotope.
This much larger penetrability enables GRD to revel structural information inside the entire crystal body, allowing the identification of subgrains, twins, lattice distortions, etc., that would not be detectable just from the surface.
Measurement resolution
For XRD, conventional x-ray tubes are used. Besides the radiation characteristic for atomic transitions of the cathode (e.g., the Kα line), the spectrally broad bremsstrahlung leads to incident photons with a large range of energies. This effectively broadens the measured rocking curves. For GRD, only narrow spectral emission lines of a radioactive isotope are used resulting in a superior energy resolution.
Mosaicity measurement
The mosaicity of a crystal denotes the distribution of crystal plane orientations, i.e., a large mosaicity corresponds to a crystal with many crystal defects (dislocations, lattice distortions etc.) whereas a high-quality crystal exhibits a low value. The exceptional energy resolution of GRD enables measurement of the crystal mosaicity via the width of the rocking curves even for our highest--quality crystals.
Our gamma diffractometer
We operate a gamma diffractometer as a versatile tool for crystal analysis with the following features
- Source: 192Ir where the 316keV / 3.92pm emission line is used for our analyses
- Angular resolution: 0.02-0.03° / 1.2-1.8’
- Setup: The crystal to be measured is mounted on a 6-axis translation to map out the rocking curve measurements along any desired direction
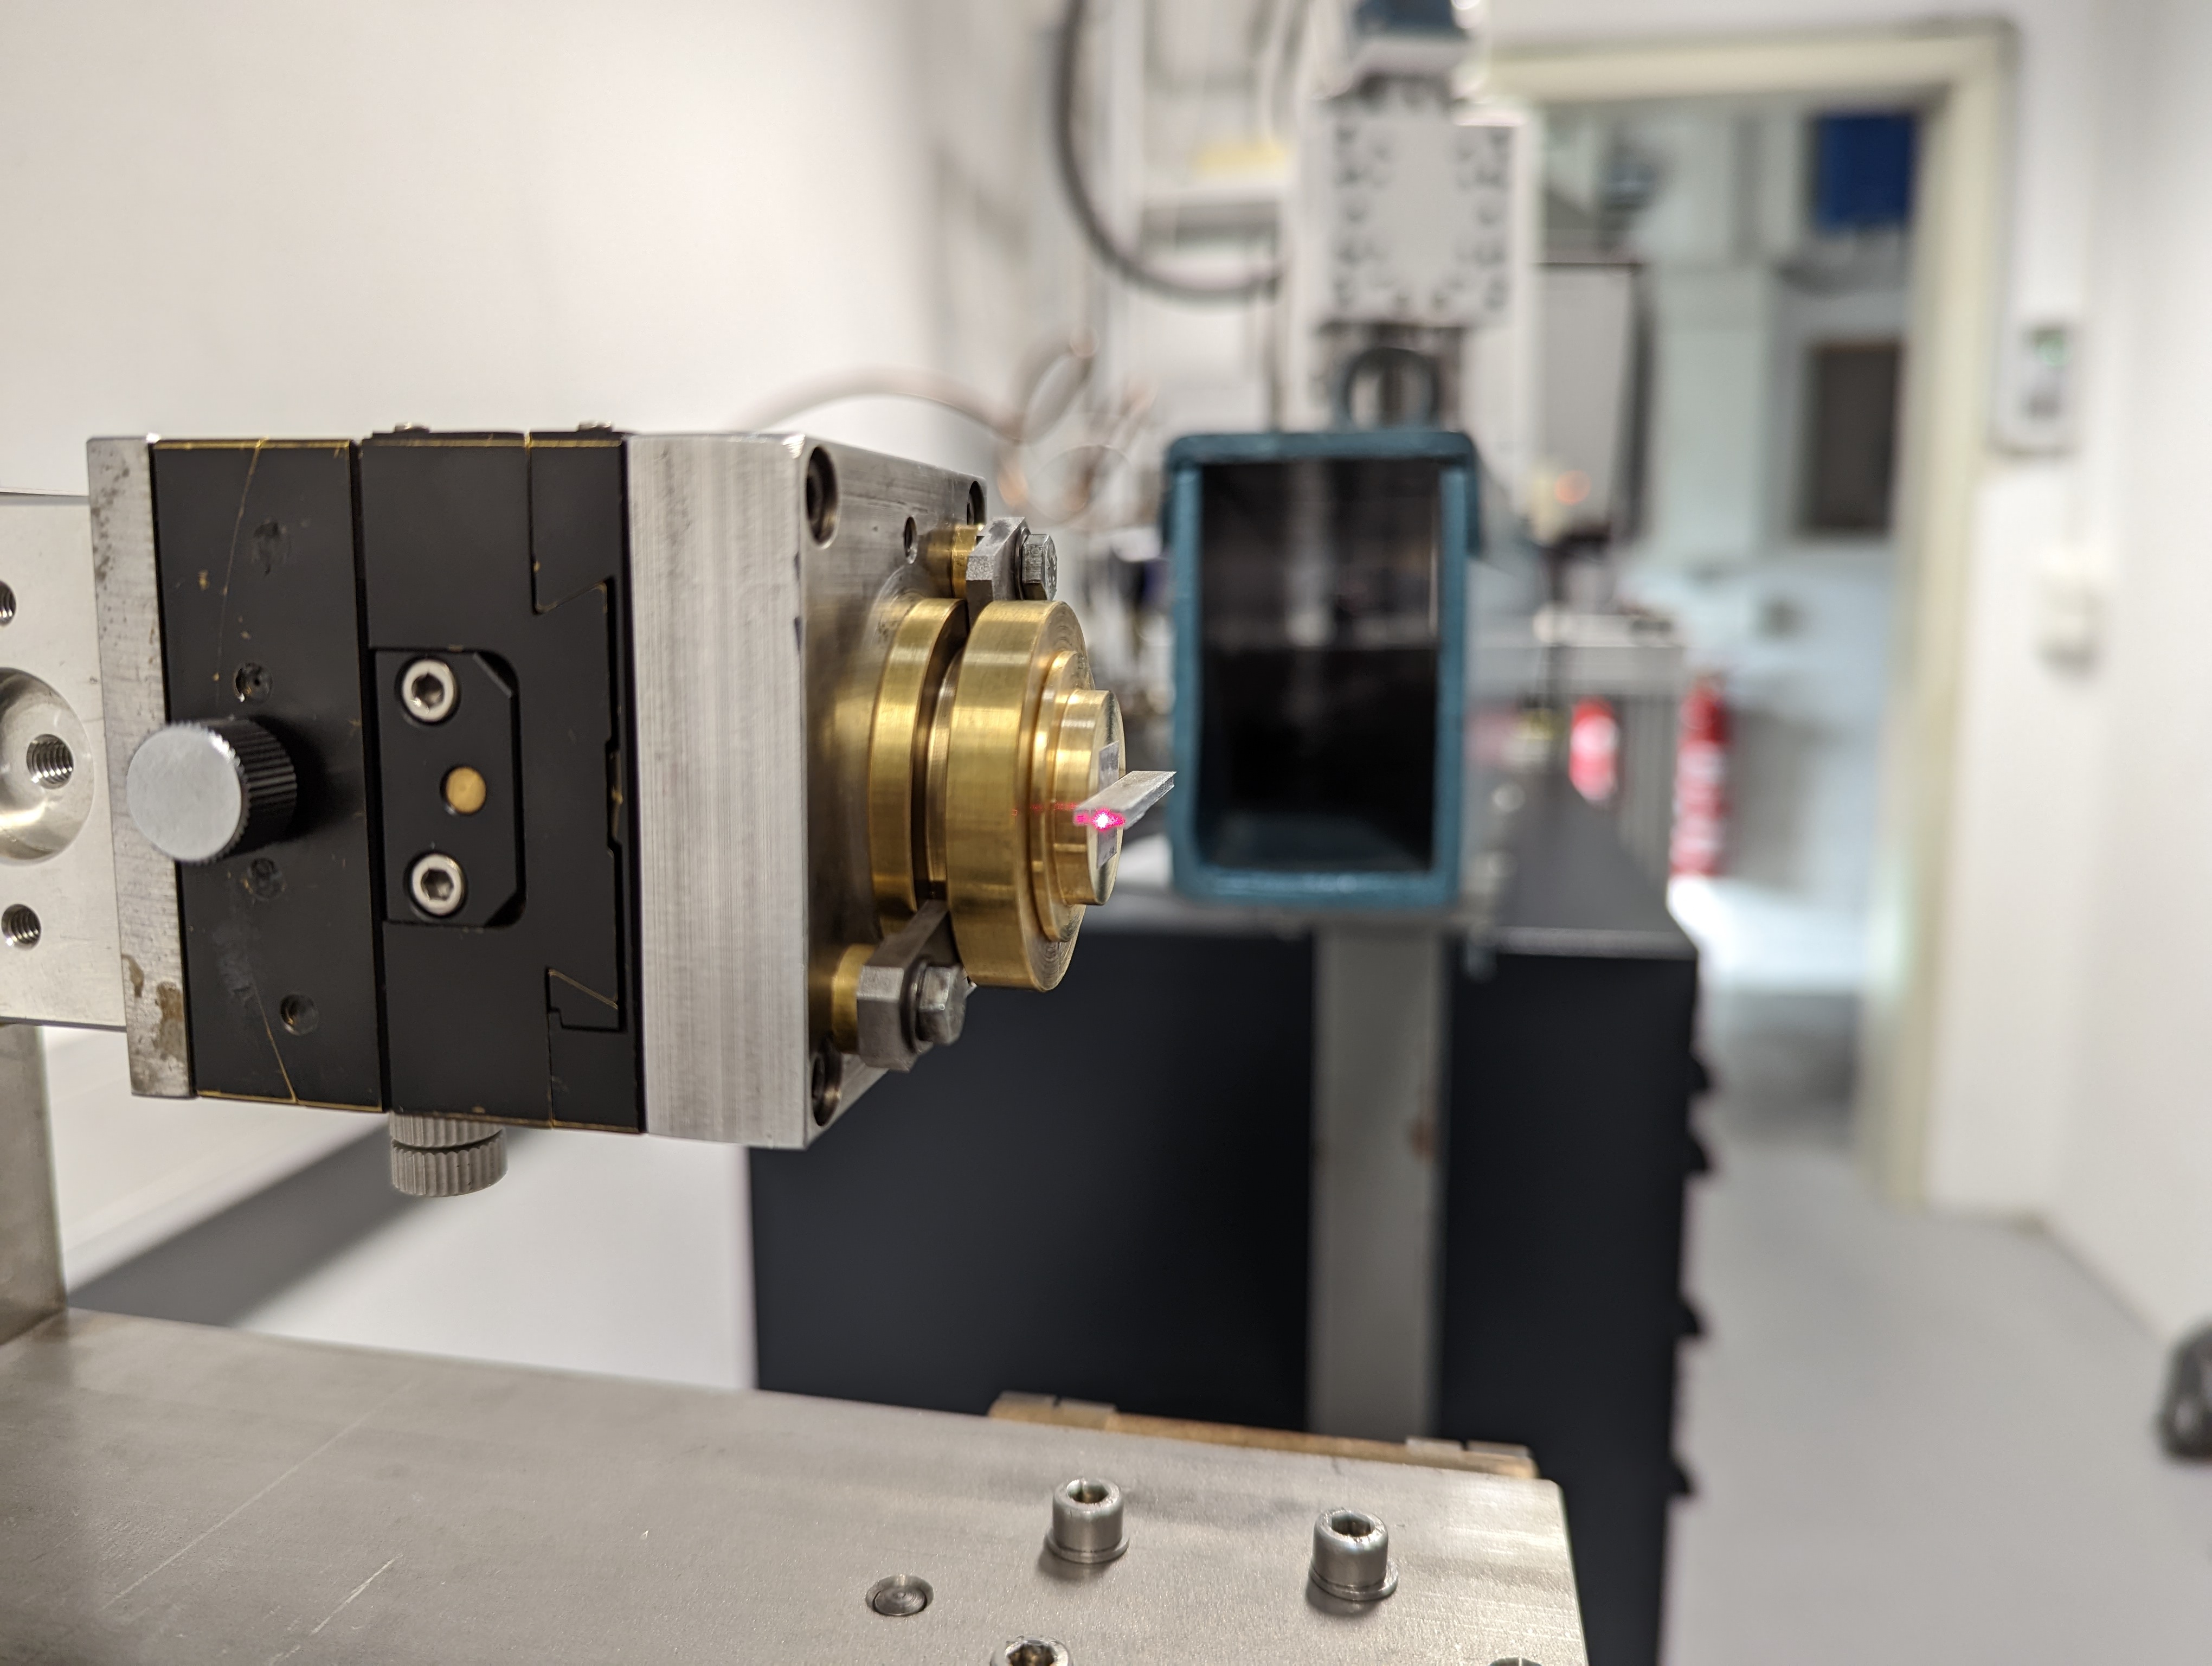
In the figure on the right, you can see an Al crystal mounted in the beam path of our gamma diffractometer. The red dot denotes where the impinging gamma rays enter the material. The diffracted beam along the entire length of the crystal is recorded by a detector in the back.
Exemplary analyses


Inquire now
Further reading
D. B. Sirdeshmukh, Current Science 72, 631 (1997)
R.S. Holt et al., Nuclear instruments and Methods in Physics Research, 221, 98 (1984)
J. R. Schneider, Journal of Crystal Growth 65, 660 (1983)
W.B. Yelon and F.K. Ross, V. Instrumentation 193, 285 (1982)
Übersicht der Elemente mit Zugang zu unserem Shop


Fax: +49 (0) 2461 - 9352 - 11